 |
 Return to Methods List |
Methods in Neuroscience Scallop Retina - RECORDING 2 |
| Some of the equipment used to stimulate the photoreceptors and record their responses | |
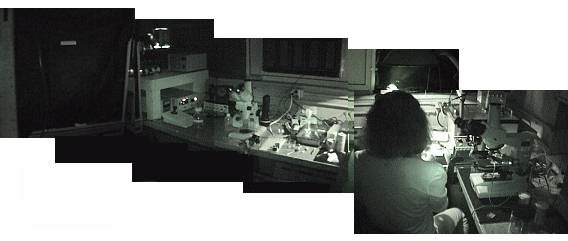 Here is the room in which the experiments are done. Note the covered windows and on the far left the covering over the recording microscope (you can't see the scope behind the black curtain). Fortunately for the experienters, the invertebrate photopigment does not bleach and can regenerate. This means that although the room is quite dark, the experiments don't have to be done in TOTAL darkness. (In contast, work on the vertebrate retina has to be done in infrared light.) |
|
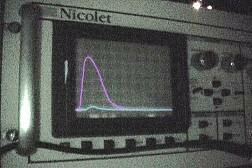 Currents elicited by the light stimuli are viewed on the oscilloscope (here the current traces have been colored by the website designer). |
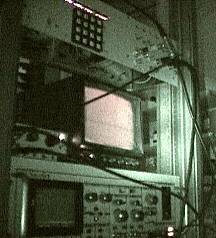 On the small monitor (pink colored) the experimenter can see whatever is seen under the microscope. |
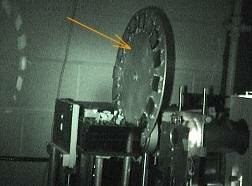 The cell's natural stimulus, light, can be used to evoke currents in the cell. Here you can see the filter rings (orange arrow) that are used to generate light of different wavelengths. |
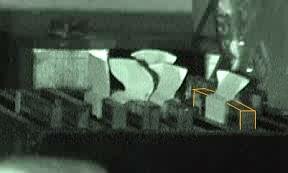 The intensity of the light is modified with neutral density filters (the webdesigner has outlined one of the filters in orange). These reduce the light intensity without changing the wavelength. |
| Examples of voltage- and current-clamp recordings Important note about the videos - the videos on this page were taken in the dark. You may need to turn out the lights in your room to see them. |
|
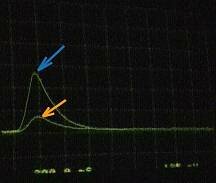 Shown here are two outward current waveforms (recorded in voltage-clamp mode) that are evoked when the hyperpolarizing-type of photoreceptor is stimulated with light of two different intensities. The current waveform marked by the orange arrow is the cell's response to light of a low intensity, whereas the waveform marked by the blue arrow is the cell's response to light of the same wavelength but a higher intensity. Click HERE for a 30-second (4MB) video showing this. |
 Here the upper trace from the last figure (shown by the blue arrow) was erased and the vertical scale was increased so that the "orange" waveform appears smaller. Another light pulse of an even stronger intensity was delivered, and the cell's reponse is shown here, marked by the purple arrow. Click HERE for a 13-second (1.9MB) video showing this. |
 Here is a voltage (i.e. current clamp) recording from the same cell. You can see that the cell hyperpolarizes in response to light. Click HERE for the final word, a 20-second (2.3MB) video from Dr. Maria Gomez. |
|
 A series of INWARD (i.e. depolarizing) current responses recorded from a rhabdomeric cell in response to four, 200ms long pulses of light of varying intensities. (courtesy of Gomez and Nasi) |
 A series of OUTWARD (i.e. hyperpolarizing) current responses recorded from a ciliary cell in response to four, 200ms long pulses of light of varying intensities. (courtesy of Gomez and Nasi) |
| Overview | Web Lectures | Fellowships | Activities | Home | SFN | NAS | IBRO |